That is of course in a ideal world. Often the storyline (aka the vertical logic) gets forgotten and the focus switches to the horizontal logic: ensuring there are indicators for each of the events in the narrative, and more!
Unfortunately, in this project, like many others, they had gone overboard with indicators. There were around 70 in all. Just trying to collect data on this set of indicators would be a major challenge for the project, let along analysing and making sense of all the data.
As readers of this blog may know, I am interested in network models as alternatives to the use of linear logic models (e.g. the Logical Framework) to represent development project plans, and their results. I am also interested in the use of network models as a means of complementing the use of Logical Framework. Within this health project, and its 70 indicators, there was an interesting opportunity to use a network model to complement and manage some of the weaknesses of the project's Logical Framework.
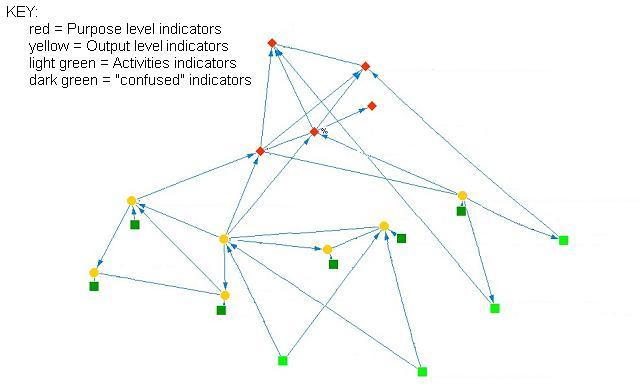
Sitting down with someone who knew more about the project than I did, we developed a simple network model of how the indicators might be expected to link up with each other. An indicator was deemed to be linked to another indicator if we thought the change that it represented could help cause the change represented by the other indicator. We drew the network using some simple network analysis software that I had at hand, called Visualyzer, but it could just have easily been done with the Draw function in Excel. I will show an "anonomised" version of the network diagram below.
When discussing the network model with the project managers we emphasised that the point behind this network analysis of project indicators was that it was the relationships between indicators that are important. To what extent did various internal Activities lead to changes in various public services provided (the Outputs)? To what extent did the provision of various Outputs affect the level of public use of those services, and their attitudes towards them (Purpose level changes)? To what extent did these various measures of public health status then related to changes in public health status (Goal level changes)?
The network model that was developed did not fall out of the sky. It was the results of some reflection on the project's "theory of change", its ideas about how things would work, how various Activities would lead to various Outputs and on to various Purpose level changes. As such it remained a theory, to be tested with data obtained through monitoring and evaluation activities. Within that network model there were some conspicuous indicators, that would deserve more monitoring and evaluation attention that others. These were indicators that (a) had an expected influence on many other indicators (e.g. govt. budget allocation), or (b) indicators that were being influenced by many other indicators (e.g. usage rates of a given health service)
The next step, on my next visit, will be to take this first rough-draft network model back to the project staff, and refine it, so it is a closer reflection of how they think the project will work. Then we will see if the same staff can identify the relationships between indicators that they think will be most critical to the project's success, and therefore most in need of close monitoring and analysis. The analysis of these critical relationships may itself not be any more sophisticated than a cross-tabulation, or graphing, of one set of indicator measure against another, with the data points reflecting different project locations.
Incidentally, the network model not only represented the complex relationships between each level of the Logical Framework, but also the complex relationships within each level of the Logical Framework. Activities happen at different times, so some can influence others, and even more so, when Activities are repeated in cycles, such as annual training events. Similarly, some Outputs can affect other Outputs, and some Purpose level changes can affect other Purpose level changes. The network model captured these, but the Logical Framework did not.


As I wrote on the TBE list, I fully agree with this approach I used with much (technical) success, even if I finally dropped it because most public agents become anguished when facing such networks ...
ReplyDeleteI re-used this just last week, when asked to build a global description of a policy I just don't know : the health policy as a whole. Around two days work (based upon existing reports, speeches, existing questionnaires, own guesses) and no interview, allowed me to highlight "nodal points" (the nodes with the highest numer of arrows) for a new health policty, and I consider such a health policy with compare favourably to the present one ...
But the next step is, to communicate such finding.
Frédéric Lefebvre-Naré
frederic /at/ lefebvre-nare.com
Rick
ReplyDeleteI've only just found this page and I need to read more...but I am looking at the interaction between livelihoods and urban infrastructure. I have found references to a range of indicators to describe networks like "connectivity", interconnectedness, clustering, size/length etc. Do you know if there is a core text which covers these metrics?
Cheers
Hi to Anonymous of jan 10th.
ReplyDeleteRe your query on network metrics...
You could start by going to my new webpage on this subject at www.mande.co.uk/Networkmodels.htm, especially the section analysing network positions and structures
There is also a good online book on network analysis by Huberman??, I think. There is a link to a section of this book, on my page above.
regards, rick
Hi Nick (and hi anonymous)
ReplyDeleteit's Hanneman, R.A. 2001. Introduction to Social Network Methods. Department of Sociology, University of California, Riverside.
Cheers
Eva