I have been working with three different organisations where the isssue of impact pathways has come up. Note the use of the plural: pathways. Network models of development projects allow the representation of multiple pathways of influence (whereby project activities can have an impact) whereas linear / temporal logic models are less conducive to this view. They tend to encourage a more singular vision, of an impact pathway.
In one research funding organisation there was a relative simple conception of how research would have an impact on peoples lives. It would happen by ensuring that research projects included both both researchers and practioners. Simple as it was, this was an improvement on the past, where research projects included researchers and did not think too much about practioners at all. But there was also room for improvement in this new model. For example, it might be that some research would have most of its impact through "research popularisers",who would collate and re-package research findings in user friendly forms, then communicate them on to practioners. And there may be other forms of research where the results were mainly of interest to other researchers.This might be the case with more "foundational" or "basic" research. So, there might be multiple impact pathways, including others yet not identified or imagined.
Impact pathways can not only extend out into the future, but also back into the past. All development projects have histories. Where their designs can be linked back to previous projects these histories can be seen as genealogies. The challenge, as with all genealogical research, is to find some useful historical sources.
Fortunately, the research funding organisation had an excellent database of all the research proposals it had considered, including those it had ended up funding. In each proposal the staff had added short lists of other previous research projects they had funded, which they thought were related and relevant to this project proposal. What the organisation has now is not just a list of projects, but also information about the web of expected influences between these projects, a provisional genealogy which stretches back more than ten years.
I have suggested to the organisation that this data should be analysed in two ways. Firstly, to identify those pieces of research which have been most influential over the last 10 to 15 years, simply in terms of influencing many other subsequent pieces of research. They could start by identifying which prior research projects were most frequently refered to in the lists attached to (funded) research proposals. This is very similar to citation analysis used in bibliometrics. These results would then need to be subject to some independent verification. Researchers' reports of their research findings could be re-read for evidence of the expected influence (incuding, but not only, their listed citations). They could also be contacted and interviewed.
The second purpose of a network analysis of past research would be to identify a sample of research projects that could be the focus of an ex-post evaluation. With the organisation concerned, I have argued the case for cluster evaluations, as a means of establishing how a large number of projects have contributed to their corporate objectives. But what is a cluster? A cluster could be identified through network analysis, as a groups of projects having more linkages of expected influence between themselves than they do have with other research projects around them. Network analysis software, such as UCINET, provides some simple means of identifying such clusters in large and complex networks, based on established social network analysis methods. Within those clusters it may also be of interest to examine four types of research projects, having different combinations of outwards influences (high versus low numbers of links to others) and inward influences (high versus low numbers of links from others).
Looking further afield it may of value for other grant making organisations to be more systematic about identifying linkages between the projects they have funded in the past, and those they are considering funding now. And then encouraging prospective grantees to explore those linkages, as a way of promoting inter-generational learning between development projects funded over the years.
Sunday, October 23, 2005
Saturday, October 22, 2005
Networks of Indicators
A few months ago I was working with a large scale health project, that was covering multiple regions within a large country. The project design was summarised in a version of the Logical Framework. Ideally a good Logical Framework can help by providing a simplified view of the project intentions, through the use of a narrative that tells how the Activities will lead to the Outputs, via some Assumptions and Risks, and how the Outputs will lead to the Purpose level changes, via some Assumptions and Risks, and so on... Running parallel to this story will be some useful indicators, telling us when various events at each stage of the story has taken place.
That is of course in a ideal world. Often the storyline (aka the vertical logic) gets forgotten and the focus switches to the horizontal logic: ensuring there are indicators for each of the events in the narrative, and more!
Unfortunately, in this project, like many others, they had gone overboard with indicators. There were around 70 in all. Just trying to collect data on this set of indicators would be a major challenge for the project, let along analysing and making sense of all the data.
As readers of this blog may know, I am interested in network models as alternatives to the use of linear logic models (e.g. the Logical Framework) to represent development project plans, and their results. I am also interested in the use of network models as a means of complementing the use of Logical Framework. Within this health project, and its 70 indicators, there was an interesting opportunity to use a network model to complement and manage some of the weaknesses of the project's Logical Framework.
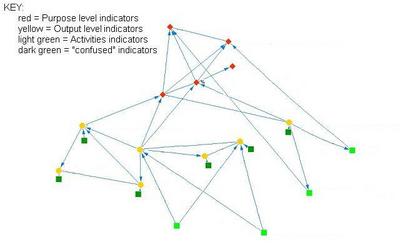
Sitting down with someone who knew more about the project than I did, we developed a simple network model of how the indicators might be expected to link up with each other. An indicator was deemed to be linked to another indicator if we thought the change that it represented could help cause the change represented by the other indicator. We drew the network using some simple network analysis software that I had at hand, called Visualyzer, but it could just have easily been done with the Draw function in Excel. I will show an "anonomised" version of the network diagram below.
When discussing the network model with the project managers we emphasised that the point behind this network analysis of project indicators was that it was the relationships between indicators that are important. To what extent did various internal Activities lead to changes in various public services provided (the Outputs)? To what extent did the provision of various Outputs affect the level of public use of those services, and their attitudes towards them (Purpose level changes)? To what extent did these various measures of public health status then related to changes in public health status (Goal level changes)?
The network model that was developed did not fall out of the sky. It was the results of some reflection on the project's "theory of change", its ideas about how things would work, how various Activities would lead to various Outputs and on to various Purpose level changes. As such it remained a theory, to be tested with data obtained through monitoring and evaluation activities. Within that network model there were some conspicuous indicators, that would deserve more monitoring and evaluation attention that others. These were indicators that (a) had an expected influence on many other indicators (e.g. govt. budget allocation), or (b) indicators that were being influenced by many other indicators (e.g. usage rates of a given health service)
The next step, on my next visit, will be to take this first rough-draft network model back to the project staff, and refine it, so it is a closer reflection of how they think the project will work. Then we will see if the same staff can identify the relationships between indicators that they think will be most critical to the project's success, and therefore most in need of close monitoring and analysis. The analysis of these critical relationships may itself not be any more sophisticated than a cross-tabulation, or graphing, of one set of indicator measure against another, with the data points reflecting different project locations.
Incidentally, the network model not only represented the complex relationships between each level of the Logical Framework, but also the complex relationships within each level of the Logical Framework. Activities happen at different times, so some can influence others, and even more so, when Activities are repeated in cycles, such as annual training events. Similarly, some Outputs can affect other Outputs, and some Purpose level changes can affect other Purpose level changes. The network model captured these, but the Logical Framework did not.
That is of course in a ideal world. Often the storyline (aka the vertical logic) gets forgotten and the focus switches to the horizontal logic: ensuring there are indicators for each of the events in the narrative, and more!
Unfortunately, in this project, like many others, they had gone overboard with indicators. There were around 70 in all. Just trying to collect data on this set of indicators would be a major challenge for the project, let along analysing and making sense of all the data.
As readers of this blog may know, I am interested in network models as alternatives to the use of linear logic models (e.g. the Logical Framework) to represent development project plans, and their results. I am also interested in the use of network models as a means of complementing the use of Logical Framework. Within this health project, and its 70 indicators, there was an interesting opportunity to use a network model to complement and manage some of the weaknesses of the project's Logical Framework.
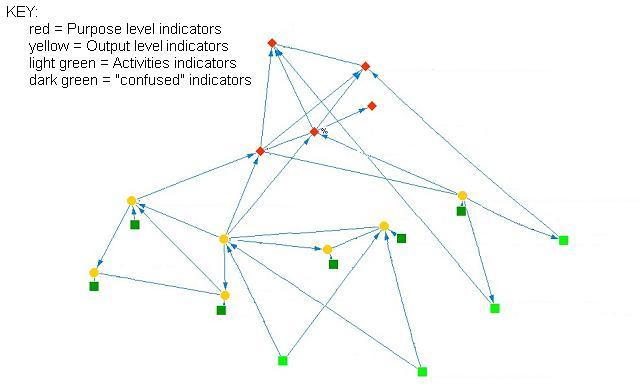
Sitting down with someone who knew more about the project than I did, we developed a simple network model of how the indicators might be expected to link up with each other. An indicator was deemed to be linked to another indicator if we thought the change that it represented could help cause the change represented by the other indicator. We drew the network using some simple network analysis software that I had at hand, called Visualyzer, but it could just have easily been done with the Draw function in Excel. I will show an "anonomised" version of the network diagram below.
When discussing the network model with the project managers we emphasised that the point behind this network analysis of project indicators was that it was the relationships between indicators that are important. To what extent did various internal Activities lead to changes in various public services provided (the Outputs)? To what extent did the provision of various Outputs affect the level of public use of those services, and their attitudes towards them (Purpose level changes)? To what extent did these various measures of public health status then related to changes in public health status (Goal level changes)?
The network model that was developed did not fall out of the sky. It was the results of some reflection on the project's "theory of change", its ideas about how things would work, how various Activities would lead to various Outputs and on to various Purpose level changes. As such it remained a theory, to be tested with data obtained through monitoring and evaluation activities. Within that network model there were some conspicuous indicators, that would deserve more monitoring and evaluation attention that others. These were indicators that (a) had an expected influence on many other indicators (e.g. govt. budget allocation), or (b) indicators that were being influenced by many other indicators (e.g. usage rates of a given health service)
The next step, on my next visit, will be to take this first rough-draft network model back to the project staff, and refine it, so it is a closer reflection of how they think the project will work. Then we will see if the same staff can identify the relationships between indicators that they think will be most critical to the project's success, and therefore most in need of close monitoring and analysis. The analysis of these critical relationships may itself not be any more sophisticated than a cross-tabulation, or graphing, of one set of indicator measure against another, with the data points reflecting different project locations.
Incidentally, the network model not only represented the complex relationships between each level of the Logical Framework, but also the complex relationships within each level of the Logical Framework. Activities happen at different times, so some can influence others, and even more so, when Activities are repeated in cycles, such as annual training events. Similarly, some Outputs can affect other Outputs, and some Purpose level changes can affect other Purpose level changes. The network model captured these, but the Logical Framework did not.
Subscribe to:
Posts (Atom)

